


Hi, I’m TestprepKart.
Your Partner In Exam Preparation
A perfect SAT score is 1600. The minimum for SAT is 400. According to the college board, in 2019, the average SAT score was 1059. But still, What is a Good SAT Score?
It is extremely vital for NRI students to set target scores because this enables them to fix up realistic goals which are as per the need of the school they are applying to. Do not just set arbitrary standards that have no base behind them. When you set result-oriented scores, your chances of a successful outcome become quite high.
In order to reach to your target SAT score first ascertain which schools you wish to get into. These will be the schools about which you are already aware and you know that getting into them isn’t that easy. Now, do not add safety schools in this list. Safety schools are the schools where you know you have a huge chance of getting accepted.
Calculate your new SAT score on basis of 1600 rather than the old 2400 SAT format. For the University of Michigan, the new target SAT Math score is 690 and EBRW score is 680. Once you attain this target you will without a doubt get admissions. Set the 75th percentile score as your target and you will be good to go.
Your chances of acceptance become pretty high when you attain this score. Nevertheless, just due to the fact that you score 75th percentile does not connote that you 75% chances of acceptance at all schools. It is actually the baseline acceptance rate for the school you choose which makes most of the difference.
To sum up, a good SAT score is a score that makes you competitive for the schools you want to attend.
To identify the answer to this we have two criteria:
If your SAT score is somewhat close to the national average, then relax, because your chances of getting admission into top schools are really high. The Higher your SAT Score, the better your chances of admission at best schools will be.
A high or Good SAT Score also helps you get merit-based aid at some of the schools, so getting a good score is really important.
But, If your SAT score is below the average national SAT score. Firstly you won’t be getting merit-based aid. then follows your acceptance rate. Because its most likely schools will ask you to take the college-readiness test again.
To be true, it matters less how you performed as compared to the national average SAT score. Because what’s more important is that you score as close to as possible to the average SAT score of your preferred school.
Not sure how to compare your SAT score to the average sat score of your preferred school? Feel free to contact our SAT Experts and they’ll be happy to guide you.
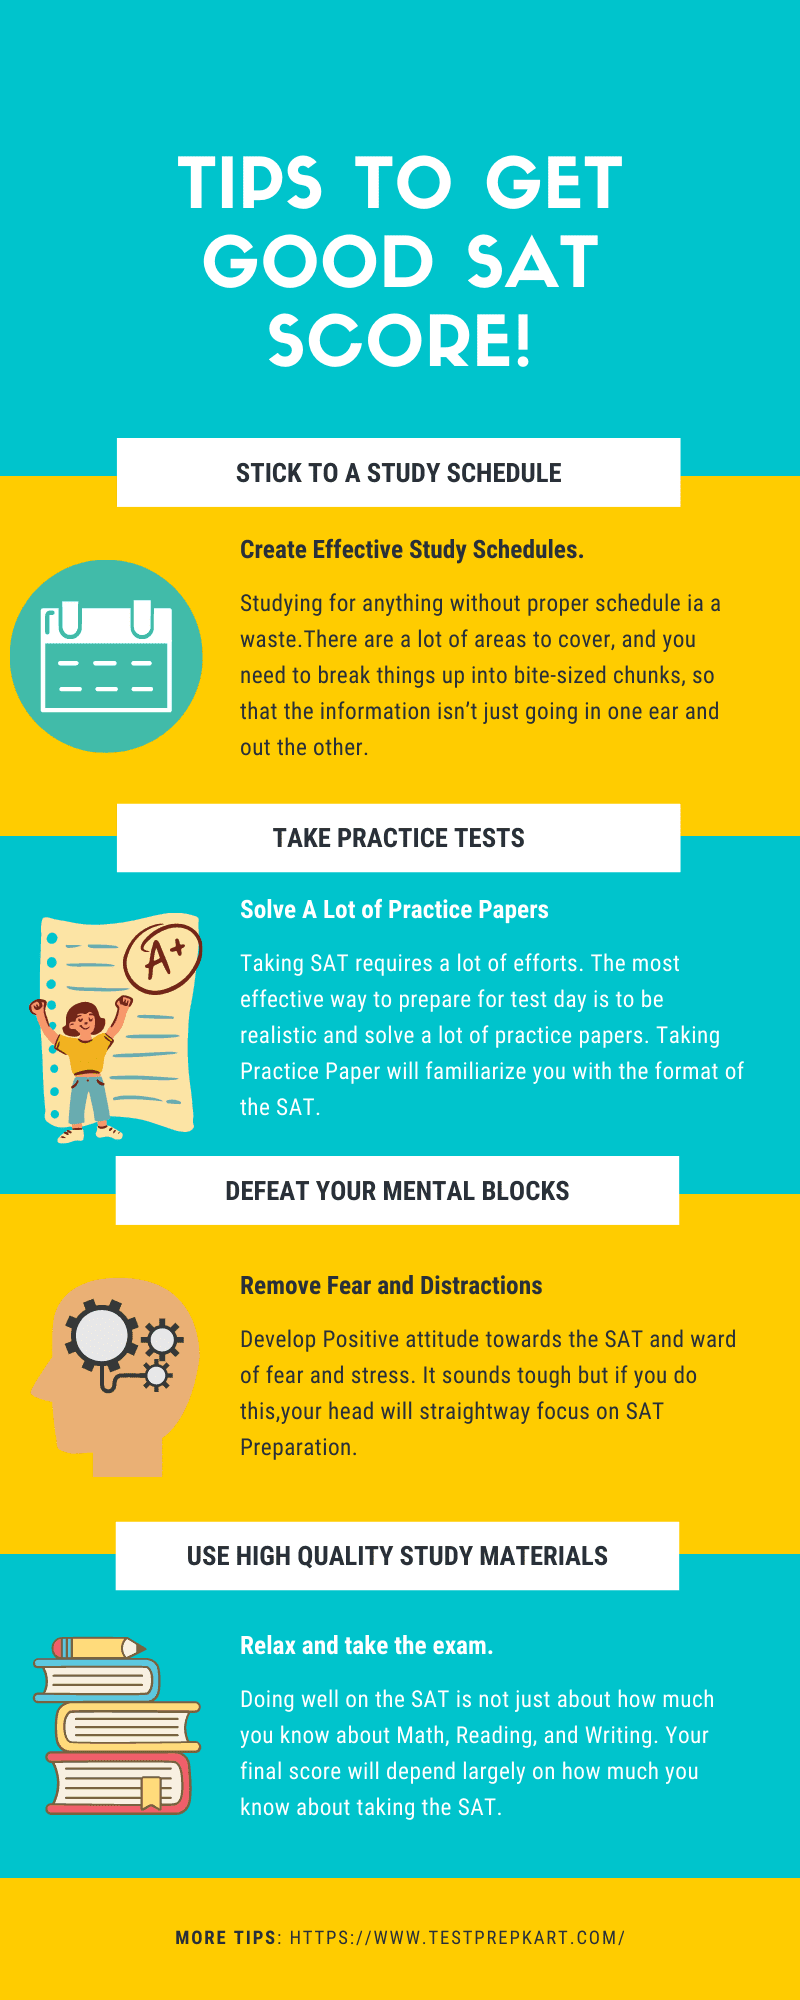
Did your SAT Score isn’t up to your preferred school average score? don’t worry many students find themselves at your position. because of poor strategies and preparation, they tend to fail at SAT Preparation. Try our SAT Online Courses to get your dream Good SAT Score.
To help you set a realistic SAT score, we’ve provided ideal average SAT scores for some popular schools.
|
School |
25th %ile SAT Score | 75th %ile SAT Score | US News Ranking | Acceptance Rate |
|---|---|---|---|---|
|
Princeton |
1440 | 1570 | 1 | 5% |
|
Harvard |
1460 | 1580 | 2 | 5% |
|
Columbia |
1450 | 1560 | 3 | 6% |
|
MIT |
1500 | 1570 | 3 | 7% |
|
Yale |
1450 | 1560 | 3 | 6% |
|
Penn |
1440 | 1560 | 6 | 8% |
|
Stanford |
1420 | 1570 | 6 | 4% |
|
UChicago |
1470 | 1570 | 6 | 7% |
|
Northwestern |
1430 | 1550 | 9 | 8% |
|
Duke |
1380 | 1540 | 10 | 9% |
|
Johns Hopkins |
1470 | 1560 | 10 | 11% |
|
Caltech |
1530 | 1580 | 12 | 7% |
|
Dartmouth |
1420 | 1560 | 12 | 9% |
|
Brown |
1420 | 1550 | 14 | 8% |
|
Notre Dame |
1400 | 1550 | 15 | 18% |
|
Vanderbilt |
1450 | 1560 | 15 | 10% |
|
Cornell |
1390 | 1540 | 17 | 11% |
|
Rice |
1490 | 1580 | 17 | 11% |
|
WUSTL |
1470 | 1570 | 19 | 15% |
|
UCLA |
1270 | 1520 | 20 | 14% |
|
Emory |
1350 | 1520 | 21 | 19% |
|
UC Berkeley |
1260 | 1480 | 22 | 15% |
|
USC |
1350 | 1530 | 22 | 13% |
|
Georgetown |
1370 | 1530 | 24 | 15% |
|
Carnegie Mellon |
1450 | 1550 | 25 | 17% |
|
U of Michigan |
1330 | 1510 | 25 | 23% |
|
UVA |
1330 | 1500 | 28 | 26% |
|
Georgia Tech |
1330 | 1520 | 29 | 23% |
|
NYU |
1310 | 1510 | 29 | 20% |
|
UC Santa Barbara |
1230 | 1480 | 34 | 32% |
|
U of Florida |
1280 | 1440 | 34 | 39% |
|
Boston College |
1320 | 1490 | 37 | 28% |
|
Boston U |
1330 | 1500 | 40 | 22% |
|
Tulane |
1350 | 1490 | 40 | 17% |
|
UT Austin |
1230 | 1480 | 48 | 39% |
|
Penn State |
1160 | 1360 | 57 | 56% |
|
U of Washington |
1220 | 1460 | 62 | 49% |
|
Clemson |
1220 | 1400 | 70 | 47% |
|
George Washington |
1280 | 1460 | 70 | 42% |
|
American |
1220 | 1380 | 77 | 32% |
|
BYU |
1190 | 1420 | 77 | 64% |
|
Baylor |
1190 | 1370 | 79 | 52% |
|
USAna University |
1150 | 1360 | 79 | 77% |
| SAT Registration | SAT Registration |
| Digital SAT Syllabus | English Prep Online |
| Digital SAT Preparation | Digital SAT Tutors |
| Digital SAT Documents Required | Hall of Fame (SAT Achievers) |

He is a Digital SAT mentor with 10+ years of experience, working primarily with SAT students all Over worldwide. Their students have consistently progressed toward 1520+ scores by improving timing, accuracy, and trap-answer control through official-style practice, detailed mistake analysis, and clear weekly action plans.
Copyright © 2024 CounselKart Educational Services Pvt. Ltd.. All Rights Reserved

Post a Comment